 |
|
|
|||||||||||||||||||||||||

Algorithms of oil spill detection on SAR images | ||||||||||||||||||||||||||||
|
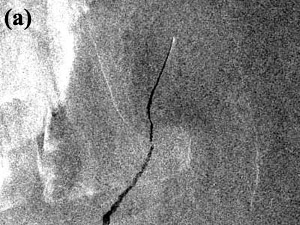
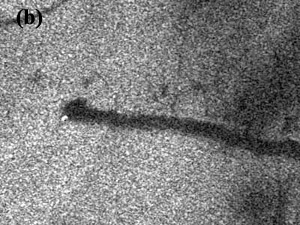
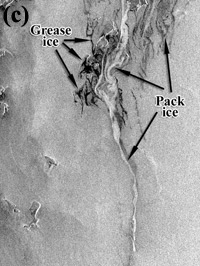
Satellite instruments are well adapted to monitor and therefore to detect oil pollution since they produce regularly images of the sea surface including the remote areas. Several kinds of measurements have been tested: optical, infrared, radars with different frequencies. Below the main attention will be given to consideration of oil spills on Synthetic Aperture Radar (SAR) images. SAR seems to be one of the most suitable instruments to the detection of slicks since slicks damp strongly short waves measured by SAR and oil spills appear as a dark patch on the SAR image. SAR observations do not depend on weather (clouds) and sunshine, which allows showing illegal discharges that most frequently appear during night. SAR can also survey storms areas, where accident risks are increased. A trained human operator is mostly able to discriminate between oil slicks and look-alikes based on experience, visual spill properties (shape and contrast between the feature and the surroundings sea), the presence and location of moving ships, oil platforms and other stationary objects relative to the dark features taking into account supplementary information (weather conditions, statistical data, geographical location of spill, and etc.) (Figure 1). The SAR signature of an oil spill and its surroundings as well as the spill shape depend on a number of parameters like wind speed, wave height, amount and type of oil released. The shape of the spill will also depend on the wind and current history between the release and the image acquisition. The constraints related to SAR measurements are of several kinds. First, wind speed value has to be between 2-3 to 10-14 m/s. Secondly, it is rather hard to distinguish oil spill from other phenomena which analogously to oil spills have negative radar contrast (look dark on SAR images) relative the surrounding waters and commonly referred to as "look-alikes". Among such "look-alikes", are films of surface active substances (mainly, natural) observable particularly at wind speed < 5-6 m/s, wind shadow areas near the coast, heavy rains damping small scale roughness, upwelling zones and grease ice (Figure 2). Thirdly, the SAR image allows detecting oil on the ocean surface only, before it goes down in sub-surface layer as a result of dispersion (see: Behaviour oil at sea).
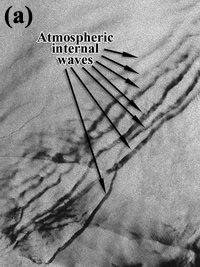
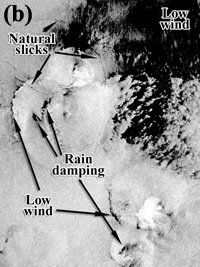
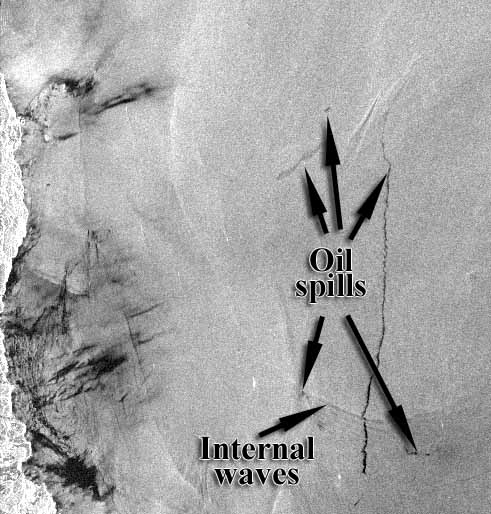
The contrast between a spill and the surrounding water, and thus the probability of detecting pollution slicks, depends on the amount and type of spilt oil as well as on environmental factors such as wind speed, wave height, SST, currents and current shift zones (Figure 3).
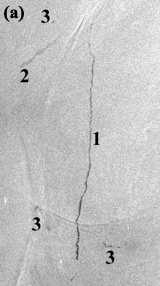
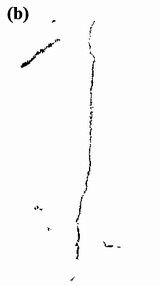
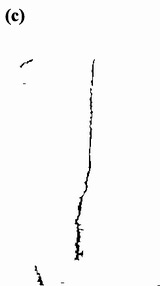
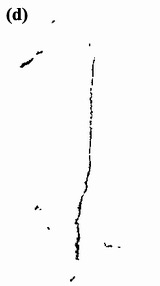
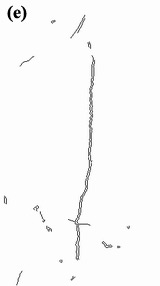
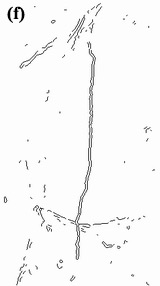
Automatic analysis of SAR images is not applied routinely yet. Several algorithms based on application of different approaches were suggested, realized and tested (Solberg et al., 1999, 2003; Kanaa et al., 2003). The process of the oil spill identification consists of several successive steps. After preprocessing (converting the original SAR data to a common format and geographical projection) and masking (to mask away all land areas, including small islets, and their innermost water areas where wind-dampening shadows often appear) the main task is detection of dark patches and bands in the image. This task is solved by application of adaptive thresholding (Solberg et al, 1999; 2003). Adaptation is necessary because of the radar contrast between a dark spot and the surrounding water depends on weather conditions (first of all, on wind speed and direction) which can change within the image under investigation. Moreover, the threshold level depends also on an incidence angle even under constant weather conditions within the image. As a result the threshold level should be changed in accordance with predetermined rules. After the initial thresholding, a clustering step is performed to check the border between the dark spot and the surrounding sea. Each spot is clustered into two clusters. If they are sufficiently apart and the darkest cluster is sufficiently large compared to the brightest, the darkest cluster is used as the spot otherwise the original spot is kept. In Image Analysis and Pattern Recognition Norwegian Computing Center Oslo, Norway, a multiscale algorithm has been developed in a pyramid-like approach. An image pyramid where a pixel on level N consists of the mean of M pixels at level N-1 is constructed. Each level in the pyramid is thresholded yielding a binary pyramid. The final spot image is constructed by combing the different binary images in the pyramid (Solberg et al. 1999, 2003). The probability of detecting the dark features increases with the increase of radar contrast between a spill and the surrounding water, which in turn is a function of spill parameters, environmental conditions and history of both oil release and weather conditions. (Environmental factors determine spreading, drift and weathering of oil on the sea surface - see: Behaviour oil at sea). Detecting the low contrast patches depends also on the speckle noise which always presents in the image. Application of different filters (available for example in several image processing software (Matlab, Envi, IDL) to the radar data decreases noise level and improves the feature detecting in the image. Next step is dark patch feature extraction. A set of 12 features used in the discrimination of oil from the look-alikes (slick complexity, number of regions in the image, slick width, slick area, distance to detected ship, slick local contrast, slick smoothness contrast, border gradient, slick local neighbours, slick global neighbours, slick power-to-mean ratio, slick planar moment) is computed for each region corresponding to a detected spot of certain minimum size. These features are a mix of standard region descriptors from image analysis, and features tailored to oil spill detection. Further task, the discrimination of oil from the look-alikes (natural slick, wind shadow zone, etc.) is the most complicated. For this task, several algorithms have been developed. An algorithm developed by Norwegian Computing Center is a combination of a statistical model for oil spills of different shapes and observed under different wind conditions, a prior model for the probability of observing oil and look-alikes, and a rule-based approach which can take care of certain expert knowledge related to oil spill detection (Solberg et al., 1999, 2003). Applicability of this algorithm to other physical-geographical conditions should be checked. One of the promising techniques for automatic discrimination of the oil spills is the calculation of fractal dimensions. Using of the simple box-counting algorithm for SAR image analyzing shows differences in the maximum fractal (box counting) dimension of oil spills compared to other types of oceanic phenomena (Gade et al., 1999). Next approach taking to the discrimination (and simultaneously to oil's contour receiving) is neural networks. Neural network is leaned on the base of confirmed oil slicks and neurons of the input layer of the network are such features as: texture characteristics, contrast ratio, border gradient and so on. The exact definition of the oil slicks contours on SAR images is of mayor importance to estimate volume of the discharged oil, predict their future evolution and prevent possible damages to the marine and coastal environment. An experienced operator can discern an oil spot among speckle noise with raster processor (e.g. "Photoshop") using local selection tools. The procedure is laborious for systematic routine monitoring of marine pollutants but widely used in research projects. There are many algorithms which offer contour definition: local and hysteresis thresholding, morphological operators, edges detection filters, variety of algorithms related to wavelet, beamlet, curvelet, ridgelet analysis. Figure 4 shows the results of interactive application of several algorithms to the definition of the oil slicks contours on a SAR image. Figure 4a is a fragment of the ERS-2 SAR image of the Japan/East Sea near the Korea coast obtained on 29 May 2000 at 02:02 UTC. This image depicts one narrow long spill (1) behind a ship, one shorter old spill (2) and several small spills (3) with low contrast. All spills were detected by the human operator with selecting tools of the "Photoshop" (Figure 4b). Figure 4c was produced from original image by using morphological operators with final inhomogeneity filtering. Figure 4d shows the result of the consequent application of the Smart Bluer filter, despeckling and thresholding. Figures 4e and 4f depict the results of application of the Canny filter with different parameters.
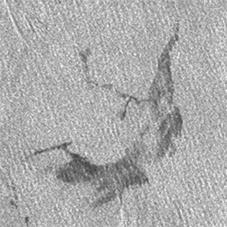
New references describing the state of the art in algorithms of oil spill detection on SAR images (Dec, 2006) Fortuny-Guasch, J. and A. Garzelli (2003). Improved Oil Slick Detection and Classification with Polarimetric SAR image analysis of the sea surface by local fractal dimension estimation. ESA SP-529: Applications of SAR Polarimetry and Polarimetric Interferometry. A study on the potential of space-borne polarimetric synthetic aperture radar (SAR) imagery for an improved detection and classification of oil spills is presented. An image data set consisting of five SIR-C/X-SAR acquisitions over the North Sea, English Channel, and Southern Italy is used. Results show that two land surface roughness indicators (i.e., the circular polarization coherence (CPC) and the polarimetric anisotropy) can also be used to identify oil spills both in L and C-Band imagery. The polarimetric anisotropy is shown to be a quite robust indicator of oil slicks on the sea surface. A wavelet-based approach to local fractal dimension estimation of SAR images of the sea surface is presented. Fractal analysis is considered as a tool for image texture characterization which can play a fundamental role to automatically detect oil slicks, and possibly distinguish them from natural surface films. A fractional Brownian motion (fBm) model is assumed for the clean sea surface. FBm processes have been proved to be suitable to describe signals backscattered by many natural surfaces, particularly by the sea surface within a certain range of scales. By using the properties of the average power spectra of fBm's, it is possible to estimated the fractal dimension, as demonstrated on synthetic fBm realizations. In this paper, a redundant wavelet representation is applied for estimating the local fractal dimension of the sea surface. By using this technique, which allows to operate at the original image resolution, all discontinuities of the fractal sea surface can be detected and accurately localized. Experimental results on true SAR images show that without considering the backscatter coefficient for calculating the fractal dimension, but only textural features, it is possible to detect oil slicks and man-made objects on the sea surface. Girard-Ardhuin F., G.G. Mercier, and R. Garello. (2003). Oil slick detection by SAR imagery: potential and limitation. Proc. OCEANS'2003, vol. 1, pp. 164-169. Girardo-Ardhuin F., G. Mercier, F. Collard and R. Garello. (2004). Oil slick detection by SAR imagery: algorithms comparison. IGARSS'04. Kanaa T.F.N., E. Tonye, G. Mercier, V.P. Onana, J.Mvogo Ngono, P.L. Frison, J.P. Rudant, and R. Garello. (2003). Detection of oil slick signatures in SAR images by fusion of hysteresis thresholding responses. Proc IGARSS 2003, vol. 4, pp. 2750-2752. Keramitsoglou, I., C. Cartalis, et al. (2003). Integrated fuzzy classification system for automatic oil spill detection using SAR images. SAR Image Analysis, Modeling, and Techniques V. Edited by Francesco Posa. Proceedings of the SPIE, Volume 4883, pp. 131-140 (2003). Synthetic Aperture Radar (SAR) images are extensively used for the determination of oil slicks in the marine environment, as they are independent of local weather conditions and cloudiness. Oil spills are recognized by the expert's eye as dark patterns of characteristic shape in particular context. However, the major difficulty to be dealt with is to differentiate between oil spills and look-alikes of natural origin. A fully automated system for the identification of possible oil spills that imitates the expert's choice and decisions has been developed. The system's architecture comprises several distinct modules of supplementary operation (georeferencing, land masking, thresholding, segmentation) and uses their contribution to the analysis and assignment of the probability of a dark image shape to be an oil spill by means of a fuzzy classifier. The output consists of several images and table providing the user with all relevant information as well as supporting decision making. The case study area was the Aegean Sea in Greece. The system responded very satisfactorily for all 35 images processed. The complete procedure described is a fully automated stand-alone application running under Windows operating system. Mercier, G., S. Derrode, W. Pieczynski, J.-M. Le Caillec and R. Garello. (2003). Multiscale oil slick segmentation with Markov chain model. Proc. IGARSS'03, Toulouse, France, vol. 6, pp 3501-3503. Nirchio, F., S. di Tomaso, et al. (2005). Oil Spills Automatic Detection from SAR Images. ESA SP-572: Envisat & ERS Symposium. Pichel, W. G., P. Clemente-Colon, et al. (2006). Routine Ocean Monitoring With Synthetic Aperture Radar Imagery Obtained From the Alaska Satellite Facility Classification methods for oil spill detection in ENVISAT ASAR images. AGU Fall Meeting Abstracts 23: 06. The Alaska Satellite Facility (ASF) has been processing synthetic aperture radar (SAR) data for research and for near-real-time applications demonstrations since shortly after the launch of the European Space Agency's ERS-1 satellite in 1991. The long coastline of Alaska, the vast extent of ocean adjacent to Alaska, a scarcity of in-situ observations, and the persistence of cloud cover all contribute to the need for all-weather ocean observations in the Alaska region. Extensive experience with SAR product processing algorithms and SAR data analysis techniques, and a growing sophistication on the part of SAR data and product users have amply demonstrated the value of SAR instruments in providing this all-weather ocean observation capability. The National Oceanic and Atmospheric Administration (NOAA) has been conducting a near-real-time applications demonstration of SAR ocean and hydrologic products in Alaska since September 1999. This Alaska SAR Demonstration (AKDEMO) has shown the value of SAR-derived, high-resolution (sub kilometer) ocean surface winds to coastal weather forecasting and the understanding of coastal wind phenomena such as gap winds, barrier jets, vortex streets, and lee waves. Vessel positions and ice information derived from SAR imagery have been used for management of fisheries, protection of the fishing fleet, enforcement of fisheries regulations, and protection of endangered marine mammals. Other ocean measurements, with potentially valuable applications, include measurement of wave state (significant wave height, dominant wave direction and wavelength, and wave spectra), mapping of oil spills, and detection of shallow-water bathymetric features. In addition to the AKDEMO, ASF-processed SAR imagery is being used: (1) in the Gulf of Mexico for hurricane wind studies, and post-hurricane oil-spill and oil-platform analyses (the latter employing ship-detection algorithms for detection of changes in oil-platform locations); (2) in the North Pacific to help locate convergence zones for marine debris detection (i.e., the GhostNet project); (3) in marine sanctuaries for internal wave climatology in support of marine ecosystem studies, and vessel detection for sanctuary protection; and (4) in coastal areas for ocean feature mapping (eddies, river plumes, upwelling, fronts). These applications demonstrations have added to our understanding of ocean and atmospheric processes and their interaction, particularly in the coastal environment. A much improved knowledge of the highly variable nature of coastal winds such as gap winds and barrier jets is a good example of the contribution that SAR imagery and derived products have made to our understanding of coastal processes. In this paper, we present results from a study on classifiers for automatic oil slick classification in ENVISAT ASAR images. First, based on our basic statistical classifier, we improve the classification performance by introducing regularization of the covariance matrixes. The new improved classifier reduces the false alarm rate from 19.6% to 13.1%. Second, we compare the statistical classifier with SVM, finding that the statistical classifier outranks SVM for this particular application. Experiments are done on a set of 103 SAR images. Solberg A.H.S., S.T. Dokken and R. Solberg. (2003). Automatic detection of oil spills in Envisat, Radarsat and ERS SAR images. Proc. IGARSS'03, 2003, vol. 4, pp.2747-2749. Steinbakk, L., J. P. Pedersen, et al. (2005). ESA/EOMD of Envisat Based Marine Surveillance Services SAR Based Oil Spill and Ship Detection Services Monitoring of marine oil spills from SAR satellite data. ESA SP-572: Envisat & ERS Symposium. A Graphical User Interface (GUI) based software package has been designed to detect and statistically analyze illicit oil spills in European Seas. The first part of the tool allows for reading and processing of multiple formats of SAR satellite data for edge detection and shape analysis and stores the spill features in a database. The second part of the tool is used to display and perform statistical analysis on the previously established database. New references describing the state of the art in algorithms of oil spill detection on SAR images (Dec, 2009) Akkartal A., F. Sunar, 2008. The usage of radar images in oil spill detection, The International Archives of the Photogrammetry, Remote Sensing and Spatial Information Sciences. Vol. XXXVII. Part B8. Beijing 2008, pp. 271-276, http://www.isprs.org/congresses/beijing2008/proceedings/8_pdf/2_WG-VIII-2/16.pdf Darkin D.V., Mitnik L.M., Dubina V.A. Investigation of structural properties of marine surface film manifestations on SAR images // Proc. 25 EARSel Symp. Global Developments in Environmental Earth Observation from Space, 2006 Millpress, Rotterdam. P. 773-783. ISBN 90 5966 042 0 1. Methodology In creation of algorithm the typical scheme [Brekke & Solberg, 2005], involving subsequent processes of dark spot detection, feature extraction and oil spill/slick/look-alike classification was used. Different methodology was applied during each subsequent phase. For illustrative purposes, the Fig. 1. shows the original SAR fragment from the selected dataset. Further figures, namely Fig. 2. through Fig. 5. shall depict various stages of algorithmic processing that happens with SAR fragment shown by Fig. 1.
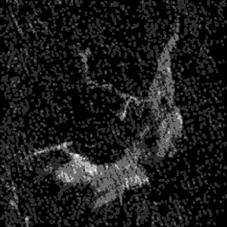
Fig. 1. Oil spill on ERS-2 image fragment, dated 10.03.1999. The frame number is 0783. 1.1. Dark spot detection Since the current paper discusses an experimental algorithm that is presently far from operational use, the process of dark spot detection was somewhat simplified, meaning that during the numerical experiments the algorithm always receives fragments already containing some form of dark patch, thus there is no need of using windowed search procedure at this time to locate the dark patch. Detection phase represent an important step and recent review of slick detection algorithms proposed by [Girard-Ardhuin et al. 2004] shows that the algorithms for detection of the slicks still have the space for improvements. In the current implementation of the algorithm detection is performed in several steps. The first step is creation of grey level mask using multiple hysteresis thresholding as in [Kanaa et al. 2003]. The values for hysteresis thresholding are obtained during the histogram analysis. The histogram divided in 10 bins. The bin locations are used as hysteresis threshold pairs. Each hysteresis threshold response was recorded as the certain grey level of the mask for the total of 4 grey levels (not including 0 level). Table 1 shows correspondence of bin numbers to the values of threshold and ultimately to the grey level number in the grey level mask of the dark spot. Levels closer to grey level 4 in the slick mask can be though of as the darkest levels in the SAR image, whereas the levels that are close to 1 are the mid-range levels in the SAR image. An example of such grey level mask (prepared for the SAR fragment depicted on Fig. 1.) is presented on Fig. 2.
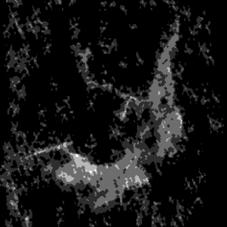
Fig. 2. Low backscatter areas are coded in the grey level mask of 4 levels (not including 0 level). Lower areas of backscatter score higher values of gray in the mask and vise versa. The second step in dark spot detection is cleaning of grey level mask. This is needed to suppress the artifacts that appear in the mask due to speckle noise. It has to be noted that no speckle filtering is performed before the algorithm. During the second step only the level 1 of the grey level mask is cleaned. On this level cleaning procedure leaves only pixels that are adjacent towards the direction of the maximal edge gradient of the values on the previous level (grey level 2). Fig. 3. depicts the cleaning effect of this procedure.
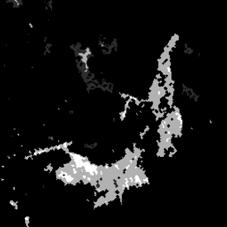
Fig. 3. Speckle-related values on level 1 of grey level mask are cleaned. The third step in the extraction of the dark spot is morphological closing operation (morphological dilation followed by erosion) that allows to close the pixel level caused by speckle noise (the higher values that have been left out after the thresholding). Fig. 4. illustrates the results of morphological closing.
Fig. 4. Morphological closing fills pixel level holes in the gray level mask. 1.2. Feature extraction The feature extraction of the detection/classification algorithms starts with performing of connected component analysis separately treating each grey level as a binary mask. This procedure searches puts pixels that are connected in one class (component) if they match connectivity pattern (8-connected in case of this research), for details see [Haralick & Shapiro, 1992]. Then for each component a number of numerical characteristics is computed: - Area - pixel area of the component; - Centroid - center of mass of the component; - Length of the Major axis of enclosing ellipse centered at centroid; - Length of the Minor axis of enclosing ellipse centered at centroid; - Eccentricity - Eccentricity of the ellipse that has the same second-moments as the region. The eccentricity is the ratio of the distance between the foci of the ellipse and its major axis length. Values close to 1 denote line segments, values close to 0 circle-like shapes; - Orientation - the angle between major axis of the ellipse and x-axis; For all components on all levels line flag is computed, denoting the line-like shapes (whose Eccentricity is more or equal to 0.9). For all components starting/ending points are identified as half distance of Major Axis towards component orientation/opposing orientation. These values are of course more valid for line segments, that for non-line ones. Based on the type of the shapes (line or non-line component) proximity criteria is either calculated as Euclidean distance between starting/ending points of lines, or as Euclidean distance between centroids of non-line shapes. All the above mentioned values constitute the feature vector that is used for subsequent analysis of the grey level mask using criteria based on Gestalt principles. 1.3. Classification The classification is based on the structure analysis, during which among all components only those are selected, which satisfy two simplest Gestalt principles [Wertheimer, 1923]: - Proximity: this principle states that two objects are easier perceived as a single object by a human being if those objects are close together. - Good continuation: this principle states that objects are easier perceived as a single object by a human being if they can be continued from one to other e.g. extrapolated somehow to form an imaginary line or a contour. Based on these two principles a number of criteria has been developed. The first group of criteria is applied if both analyzed components are lines. For those proximity is defined as minimum of Euclidean distances between ending/starting points of these lines and the good continuation is analyzed by checking the difference in orientation. The second group of criteria is applied if both objects are not lines. An example of such criteria is enclosure of one component by another (centroids are proximal and major/minor axes of one component is smaller that that of the other). The third group of criteria analyses relation of lines to non-lines. They define selection of components if line is sufficiently long (major axis exceeds threshold) and the non-line shape is proximal to the line shape. The analysis is performed recursively by two routines: - In-level routine: Analyzes the components on a level N = {3, 2, 1} to obtain the slick structure on these level. Structure is composed from the elements that satisfy the criteria outlined above or in other words select the fragments that satisfy proximity criteria (Euclidean distance used) and good continuation criteria (several criteria constructed from numerical characteristics gather for each component). For each component of level N selected as the slick structure call the inter-level routine to group it with structures from lower levels. - Inter-level routine: Given a component from a level N > 1 search all components on the level N-1 and find component that satisfies Gestalt-based criteria. Set this component as current, set the level N = N-1 and call Inter-level routine again. Stop the analysis either when current level is N = 1or when there are no components to analyze. The analysis starts from level 4 of the grey level mask. This level denotes the areas of the lowest backscatter in the SAR image. If the grey level 4 contains too few pixels (e.g. less than 1 percent of the fragment area), then merge level 3 and level 4. For the current experimental version of the algorithm all components of the level 4 were automatically considered as belonging to the slick structure, thus for each component of grey level 4, inter-level analysis routine is run. It is needed to notice however that often the most dark areas of the SAR fragments with slick correspond look-alikes (e.g. low-wind) areas, thus for the future versions of the algorithm such assumption should not be valid. For levels N = {3, 2, 1} the in-level analysis routine is run to find relevant structures on levels of the mask that correspond to less-dark areas of SAR image. These structures then are passed to the inter-level analysis routine for subsequent analysis.
Fig. 5. Final grey level mask prepared with slick-relevant structure extracted by the algorithm. All components that were selected during all stages of the analysis are retained in the image mask while the others are considered as noise and removed from the mask. The Fig. 5. concludes the series of illustrations that outline the performance of the algorithm and shows the resulting grey level mask containing slick structure with various levels of gray corresponding to most damped / less damped areas of sea surface roughness. Derrode S., G. Mercier, 2007. Unsupervised multiscale oil slick segmentation from SAR images, Pattern Recognition, Vol. 40, N 3, pp. 1135-1147. Gambardella A., G. De Grandi, T. Ainsworth, M. Migliaccio, 2008. Sea oil spill observation by means of analysis of spatial statistics in polarimetric SAR data using wavelet signatures, SeaSAR 2008, the 2nd international workshop on advances in SAR oceanography from Envisat and ERS missions, 21-25 January 2008, Rome, Italy. http://earth.esa.int/workshops/seasar2008/participants/242/pres_242_gambardella2.pdf Ivanov A.Yu., Zatyagalova V.V. A GIS approach to mapping oil spills in a marine environment, Intern. J. Rem. Sens., Vol. 29, N 21, pp. 6297-6313 A geographic information system (GIS) can contribute significantly to the correct interpretation of the slick signatures visible on synthetic aperture radar (SAR) images. Initially, GIS has proven to be an excellent management tool for resource assessment, oil spill response and planning, and damage assessment. The GIS approach to the problem of oil spill mapping includes integration of the geographical, remote sensing, oil and gas production/infrastructure data and slick signatures, detected by SAR, in GIS. Compiled from data from several sources including nautical maps, geodatabases, ground truth and remote sensing data, GIS allows the retrieval of key information, such as predicting oil spill locations, revealing offshore/onshore sources, and estimating the intensity of oil pollution. SAR and GIS technologies can improve the identification and classification of oil spills, leading to construction of the final product, an oil spill distribution map. This approach has been applied to oil spill mapping in the Sea of Okhotsk, the Caspian Sea, the Black Sea and the Gulf of Thailand. We conclude that the combination of GIS and SAR technologies provides an ideal solution for understanding the spatial/temporal distribution of oil spills in the marine environment and is considered as the core of the oil spill monitoring system. Karantzalos K., A. Demeter, 2006. Automatic detection of oil spills with level set segmentation technique from remotely sensed imagery, Intern. Symp. Rem. Sens., Seoul, South Korea, pp. 126-129. A new object-oriented methodology to detect oil spills using Envisat images, 2007, Proc. Envisat Symp. 2007, Montreux, Switzerland, 23-27 April 2007, ESA Publication SP-636, 5 pp. Karantzalos K., D. Argialas, 2008. Automatic detection and tracking of oil spills in SAR imagery with level set segmentation, Intern. J. Rem. Sens., Vol. 29, N 21, pp. 6281-6296. Level set segmentation Since the early 1990s, both in remote sensing (Argialas and Harlow 1990, Jensen 2000, Lillesand et al. 2003) and computer vision (Perona and Malik 1990, Paragios et al. 2005) communities, the fact that efficient object detection from images demands advanced image processing techniques has been addressed. Standard segmentation methods, such as using thresholds, yield limited results and, particularly for SAR imagery, a constant threshold value for the whole image cannot be recommended as the mean level of the background varies, even in a homogeneous sea, due to the image acquisition system (Gasull et al. 2002). Even the use of an adaptive threshold leads to limited results since it produces numerous look-alikes and small noisy blobs and demands and also requires extensive computational time (Gasull et al. 2002, Solberg et al. 1999, 2007). In this paper, the detection of possible oil spills is performed by a geometric level set segmentation that acts globally in an image, in contrast to the pixel-based threshold or edge detection methods. These models are based on the theory of curve evolution and geometric flows and, in particular, on the mean curvature motion of Osher and Sethian (1998), with numerous successful applications for computer vision feature extraction tasks (Osher and Paragios 2003, Paragios et al. 2005) such as in medical image processing for detecting and tracking tumours, in industry for detection tasks during robot controlling processes, in modelling objects or environments, for visual surveillance, etc. Global methods, aiming to understand how images can be segmented into meaningful regions, are one of the main problems of natural and computational vision (Tsai et al. 2001, Paragios et al. 2005). Let I(x) (where x is a bi-variable (x, y)) be an image defined on a domain W without any particular geometrical structure. One of the key features is the segmentation process partitioning W into domains Wi, on which the image I is homogeneous and which are delimited by a system of crisp and regular boundaries (qualitative discontinuities) K. In Bayesian models, two parts exist: the prior model and the data model. Here, the prior model takes a priori the phenomenological evidence of what is qualitatively a segmentation, namely an approximation of image I by piecewise smooth functions u on W2K, which are discontinuous along a set of edges K. The aim is to introduce a way of selecting, from among all the allowed approximations (u, K) of I, the best possible one. For this, Mumford and Shah (1989) used an energy functional E(u, K) that contains three terms: 1. A term that measures the variation and controls the smoothness of u on the open connected components Wi of W2K, 2. A term that controls the quality of the approximation of I by u and 3. A term that controls the length, the smoothness, the parsimony and the location of the boundaries K, and inhibits the spurious phenomenon of oversegmentation. The Mumford and Shah (MS) energy that was implemented here, following the ideas of Chan and Vese (1999) and Tsai et al. (2001), is described by the following functional:
Keramitsoglou I., C. Cartalis, C. T. Kiranoudis, 2006. Automatic identification of oil spills on satellite images, Environmental Modelling & Software, Vol. 21, Issue 5, pp. 640-652. Mercier G., F. Girard-Ardhuin, 2006, Partially supervised oil-slick detection by SAR imagery using kernel expansion, IEEE Trans. Geosci. Remote Sens., Vol. 44, N pp. 2839-2846. Montali A., G. Giacinto, M. Migliaccio, A. Gambardella, 2006. Supervised pattern classification techniques for oil spill classification in SAR images: Preliminary results, Proc. SEASAR 2006, ESA publication SP-613, Frascati, Italy, 23-26 January, 6 pp. Nunziata F., A. Gambardella, M. Migliaccio, 2008. Oil spill detection by means of dual polarized SAR data, SEASAR 2008, the 2nd international workshop on advances in SAR oceanography from Envisat and ERS missions, 21-25 January, Frascati, Italy. http://earth.esa.int/workshops/seasar2008/participants/214/pres_214_nunziata.pdf Özkan C., F. Sunar, 2007. Comparisons of different semi-automated techniques for oil-spill detection: A case study in Lebanon, 27th EARSel Symposium, 4-7 June, Bolzano, Italy. Pelizzari S., J. M. Bioucas Dias, 2006. Bayesian adaptive oil spill segmentation of SAR images via graph cuts, Proc. SEASAR 2006, ESA publication SP-613, Frascati, Italy, 23-26 Jan., 6 pp. Ramalho G.L.B., F.N.S. Medeiros, Using boosting to improve oil spill detection in SAR Images, 2006, 18th Intern. Conf. on Pattern Recognition (ICPR), Hong Kong, China, Vol. 2, pp. 1066-1069. Solberg A.H.S., C. Brekke, P.O. Husøy, 2007. Oil spill detection in Radarsat and ENVISAT SAR images, IEEE Trans. Geosci. Rem. Sens., Vol. 45, N 3, pp. 746-755. Solberg A.H.S., C. Brekke, 2008. Oil spill detection in northern European waters: approaches and algorithms, In Remote Sensing of the European Seas, V. Barale, M. Gade, Editors, Springer: Dordrecht, The Netherlands, pp. 359-370. Tello M., C. Lopez-Martinez, J. Mallorqui, 2006. A novel algorithm for automatic ship and oil spill detection based on time-frequency methods, Proc. SEASAR 2006, ESA publication SP-613, Frascati, Italy, 23-26 January, 6 pp. Tello M., C. Lopez-Martinez, J. Mallorqui, 2008. Unsupervised oil spill detection in SAR imagery through an estimator of local regularity, SeaSAR 2008, the 2nd international workshop on advances in SAR oceanography from Envisat and ERS missions, 21-25 January, Rome, Italy http://earth.esa.int/workshops/seasar2008/participants/112/pres_112_tello.pdf Topouzelis K., V. Karathanassi, P. Pavlakis, D. Rokos, 2007. Detection and discrimination between oil spills and look-alike phenomena through neural networks, ISPRS J. Photogrammetry Rem. Sens., Vol. 62, N 9A, pp. 264-270. Topouzelis K., D. Stathakis, V. Karathanassi, 2009. Investigation of genetic algorithms contribution to feature selection for oil spill detection, Intern. J. Rem. Sens., Vol. 30, N 3, pp. 611-625. Topouzelis K.N., 2008. Oil spill detection by SAR images: Dark formation detection, feature extraction and classification algorithms, Sensors, Vol. 8, N 10, pp. 6642-6659, DOI: 10.3390/s8106642. |

| Site statistics . | |||