Marine satellite remote sensing data used for oil spill monitoring |
Estimations of the total amount of oil entering into the ocean each year are varied from 1.5 to 8 million m3. More then 20% of all oil contamination falls at unauthorized discharges of the polluted water from the ships into navigable waters (Table 1).
Table 1. Sources of the ocean oil pollution (worldwide each year)
(from http://seawifs.gsfc.nasa.gov/OCEAN_PLANET/HTML/peril_oil_pollution.html).
| Source |
Amount (thousands m3) |
Percentage (%) |
| Big Spills |
148 |
5.6 |
| Routine Maintenance |
548 |
20.8 |
| Down the Drain |
1452 |
55.0 |
| Up in Smoke |
368 |
13.9 |
| Offshore Drilling |
60 |
2.3 |
| Natural Seeps |
62 |
2.4 |
| Total |
2638 |
100 |
Investigations carried out with spaceborne SAR in Baltic, North and Midterrian Seas revealed oil spills along main ship routes, which ranged from 0.1 km2 to 56 km2 ("Clean Seas", Pavlakis et al., 2001). Most of spills have area size about 1-10 km2, length 5-10 km, width < 1 km and occurred during night time. Such dimensions of the marine oil contamination require use high resolution sensors (<200 m). First of all these are instruments providing high resolution imagery in a range of visible and infra-red bands. Similar sensors were placed on the satellites series Landsat (USA), Spot (France), Resurs-O (Russia) and IRS (India). Past and present missions from these series are represented in Table 2 and their high resolution imagers in Table 3. These missions are used mostly for high resolution land studies, but images from these satellites are successfully utilized in coastal marine pollutions monitoring. The major disadvantages of the thermal and optical sensors are unsuitability for cloudiness areas and night limitation for visible bands.
Next kind of the high resolution sensors used in marine oil pollution monitoring is synthetic aperture radars (SAR). Among the many different sensors SAR is probably the most sophisticated, because of its independence of weather and light conditions. Oil slicks appear as dark patches on SAR images because of the damping effect of the oil on the backscattered signals from the radar instrument. All space missions carried SAR are showed in Table 4 and Table 5 and properties of their SAR are represented in Table 6.
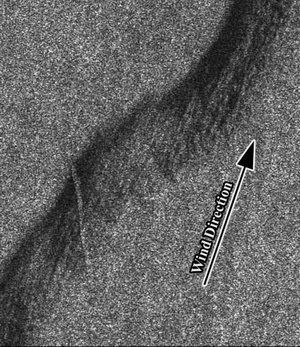
The most suitable SAR radar configuration for oil pollution study is C-band radar frequency with VV polarization, with a 20 to 45° incident angle. This is the case for ERS, RADARSAT and Envisat satellites. ERS SAR imagery was additionally useful for oil spill monitoring due to ability to recover the surface wind characteristics which are very important for oil weathering. Wind direction can be retrieval from an orientation of the organized structures in the atmospheric boundary layer (convective rolls) that clearly manifest themselves in the SAR images, as well as can be estimated from backscatter variation near the islands and capes. Wind speed is retrieved with CMOD4 geophysical function. In many cases wind direction can be derived from oil spots themselves. Old oil spills have on the upwind sites roughly parallel bands oriented in the wind direction (Figure 1).
The spatial coverage of the SAR imagery is adapted to pollution survey (100 x 100 km for ERS-1 and ERS-2; 300 x 300 km for RADARSAT, and from 100x 100 km to 405 x 405 km (wide swath) for ASAR Envisat). A problem is the satellite coverage frequency (35 days for ERS), but now RADARSAT SAR and Envisat ASAR allow covering every 2-3 days for accident cases. Figure 2 shows Envisat ASAR Wide Swath Mode image of the Japan/East Sea taken on 7 April 2003. All dark patches on the low resolution image (Figure 2a) are associated with the fields of lower surface wind speed. Enlarged fragment of the image (resolution 150x150 m) depicts distinct oil contamination with total area about 110 km2 (Figure 2b). For example, approximately similar circular area with radius about 40 km can be fully covered on August 2004 by 12 ASAR Wide Swath frames (Figure 3) and additionally partly covered by 4 frames. But in operational context it would be useful to improve this to have regular survey. The delay between acquisition and analysis must be shortened.
| Figure 1. |
Fragment of the ERS-2 SAR image of the Japan/East Sea acquired on 22 September 1997 at 02:00 UTC. Oil spill is darker on the leeward side. Upwind part of the spill is organized into nearly parallel bands aligned in the wind direction. Near vertical light line crossed the spill is a ship wake. |
| a. |
b. |
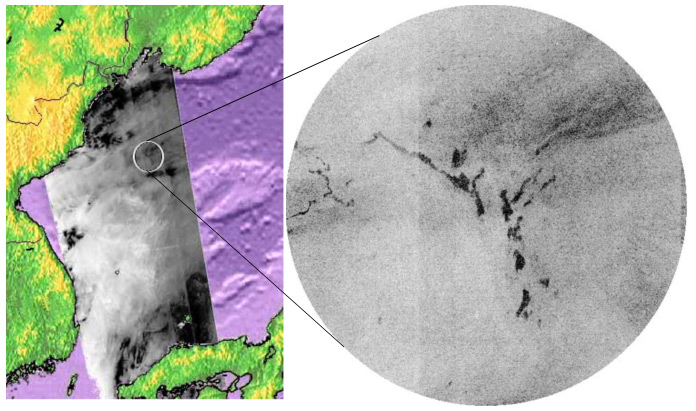 |
| Figure 2. |
Envisat ASAR Wide Swath Mode image of the Japan/East Sea taken on 7 April 2003 at 13:07 UTC.
(a) Low resolution image with dark patches associated with the fields of lower surface wind speed.
(b) Enlarged fragment (resolution 150x150 m) depicting oil contamination with total area about 110 km2. |
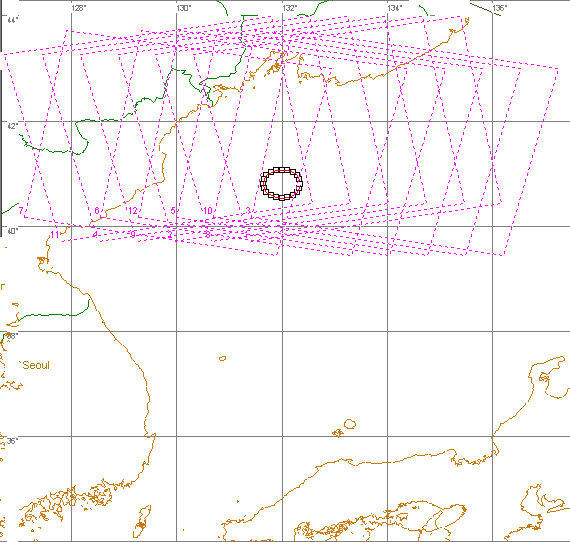
| Figure 3. |
Envisat ASAR Wide Swath Mode covering of the circular area with radius approximately 40 km on August 2004. |
|
|